lans.cloud Tools

Test Grade Calculator

Free test grade calculator for teachers: percentage and letter grade from wrong answers or a typed score (34.75/40 works), a full printable grading chart, and curve modes (+points or best-paper-equals-100%).

Quick answer

8 questions wrong out of 40 is 80% — a B−. The grade is (total − wrong) ÷ total × 100 on the standard US scale (90%+ is an A range, 80s are Bs, 70s are Cs, 60s are Ds, below 60% is an F). Enter the number of questions and how many were missed, or switch to score mode and type the score as it stands: 34.75 out of 40 grades as 86.9%, a B. Any test size from 1 to 500 questions.
Was this tool helpful?
Support this site

More tools

Grade a Stack of Tests in Minutes

Marking 30 papers with 27 questions each means 30 rounds of the same mental math. This test grade calculator removes all of it: set the number of questions once, and the full chart shows the percentage and letter grade for every possible number of wrong answers. As you mark each paper, tap the + stepper per mistake and read off the grade — the matching chart row highlights automatically.

It is the digital version of the slide-style “EZ grader” chart, with two upgrades: it handles up to 500 questions, and it shows one decimal place. That second one earns its keep on the lengths that do not divide neatly: 2 wrong out of 15 is 86.666…%, which grades as a B at 86.7% — round it to a whole number instead and it reads 87%, a B+. One decimal place is the difference between those two papers.

The Math Behind the Grade

The score is simply correct answers divided by total questions: (total − wrong) ÷ total × 100. Letter grades then follow the standard US scale — 90% and above is an A range, 80s are Bs, 70s are Cs, 60s are Ds, and anything below 60% is an F, with plus/minus bands at roughly three-point intervals. Schools vary (some skip plus/minus entirely, so anything in the 90s is just an A; others drop the A− band and draw the A line at 93%), so the exact scale is printed under the chart for easy adjustment.

Tips for Faster Grading

  • Sort before you grade: mark all papers question-by-question rather than paper-by-paper — errors are easier to spot when you see the same answer thirty times.
  • Count wrong, not right: on a good class set there are far fewer mistakes than correct answers, and this calculator is built around exactly that count.
  • Print the chart: the grading chart for your question count is a clean table — screenshot it for grading offline or share it with a co-teacher.
  • Partial credit? Do not convert half marks into extra questions. Score mode grades what is written on the paper, and the result stays a score instead of a wrong-answer count that was never whole.

Grade the Test Sizes Teachers Mark Most, at a Glance

The most common test lengths — from 8-question quizzes to 50-question exams, including the odd sizes teachers actually grade (14, 17, 18, 32, 35, 40) — condensed to the rows where the letter grade changes: scan down to the number wrong and read the grade. For any other size (a 36-question quiz, a 75-question final), set the question count in the calculator above and get the full chart. If what you want is a sheet for the wall rather than a number for this paper, our grading scale charts lay out a full printable chart, band by band, for each of the standard test lengths.
8-question test — grade boundaries

# WrongPercentGrade
0100%A+
187.5%B+
275%C
362.5%D-
80%F

Each row is the most wrong answers that still earn the grade shown (standard US scale, 8 questions).

10-question test — grade boundaries

# WrongPercentGrade
0100%A+
190%A-
280%B-
370%C-
460%D-
100%F

Each row is the most wrong answers that still earn the grade shown (standard US scale, 10 questions).

14-question test — grade boundaries

# WrongPercentGrade
0100%A+
192.9%A-
285.7%B
378.6%C+
471.4%C-
564.3%D
140%F

Each row is the most wrong answers that still earn the grade shown (standard US scale, 14 questions).

15-question test — grade boundaries

# WrongPercentGrade
0100%A+
193.3%A
286.7%B
380%B-
473.3%C
566.7%D
660%D-
150%F

Each row is the most wrong answers that still earn the grade shown (standard US scale, 15 questions).

17-question test — grade boundaries

# WrongPercentGrade
0100%A+
194.1%A
288.2%B+
382.4%B-
476.5%C
570.6%C-
664.7%D
170%F

Each row is the most wrong answers that still earn the grade shown (standard US scale, 17 questions).

18-question test — grade boundaries

# WrongPercentGrade
0100%A+
194.4%A
288.9%B+
383.3%B
477.8%C+
572.2%C-
666.7%D
761.1%D-
180%F

Each row is the most wrong answers that still earn the grade shown (standard US scale, 18 questions).

20-question test — grade boundaries

# WrongPercentGrade
0100%A+
195%A
290%A-
385%B
480%B-
575%C
670%C-
765%D
860%D-
200%F

Each row is the most wrong answers that still earn the grade shown (standard US scale, 20 questions).

25-question test — grade boundaries

# WrongPercentGrade
0100%A+
196%A
292%A-
388%B+
484%B
580%B-
676%C
772%C-
868%D+
964%D
1060%D-
250%F

Each row is the most wrong answers that still earn the grade shown (standard US scale, 25 questions).

30-question test — grade boundaries

# WrongPercentGrade
0100%A+
293.3%A
390%A-
583.3%B
680%B-
873.3%C
970%C-
1163.3%D
1260%D-
300%F

Each row is the most wrong answers that still earn the grade shown (standard US scale, 30 questions).

32-question test — grade boundaries

# WrongPercentGrade
0100%A+
293.8%A
390.6%A-
487.5%B+
584.4%B
681.3%B-
778.1%C+
875%C
971.9%C-
1068.8%D+
1165.6%D
1262.5%D-
320%F

Each row is the most wrong answers that still earn the grade shown (standard US scale, 32 questions).

35-question test — grade boundaries

# WrongPercentGrade
197.1%A+
294.3%A
391.4%A-
488.6%B+
585.7%B
780%B-
877.1%C+
974.3%C
1071.4%C-
1168.6%D+
1265.7%D
1460%D-
350%F

Each row is the most wrong answers that still earn the grade shown (standard US scale, 35 questions).

40-question test — grade boundaries

# WrongPercentGrade
197.5%A+
295%A
490%A-
587.5%B+
685%B
880%B-
977.5%C+
1075%C
1270%C-
1367.5%D+
1465%D
1660%D-
400%F

Each row is the most wrong answers that still earn the grade shown (standard US scale, 40 questions).

50-question test — grade boundaries

# WrongPercentGrade
198%A+
394%A
590%A-
688%B+
884%B
1080%B-
1178%C+
1374%C
1570%C-
1668%D+
1864%D
2060%D-
500%F

Each row is the most wrong answers that still earn the grade shown (standard US scale, 50 questions).

How to calculate a test grade

Two ways in — count the wrong answers, or type the score you already have — and the same percentage and letter come out.

  1. Set the number of questions

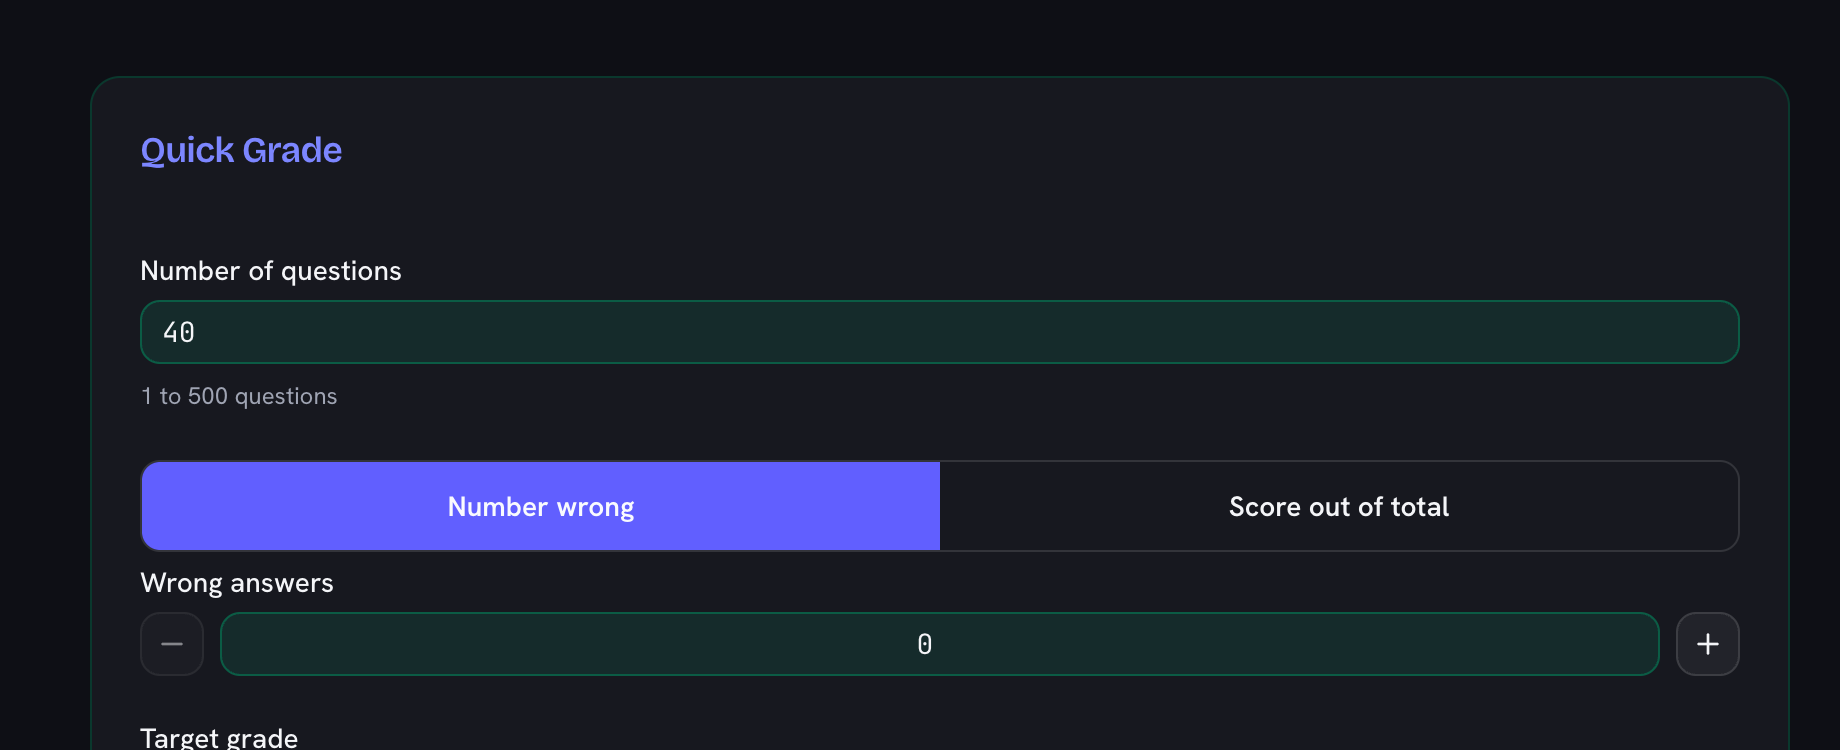
    Type how many questions the test has, anywhere from 1 to 500. The grading chart rebuilds for that exact length, so a 36-question quiz gets its own chart rather than the nearest standard one.

    The Quick Grade card with the test length set to 40 questions
  2. Enter the wrong answers, or switch to score mode

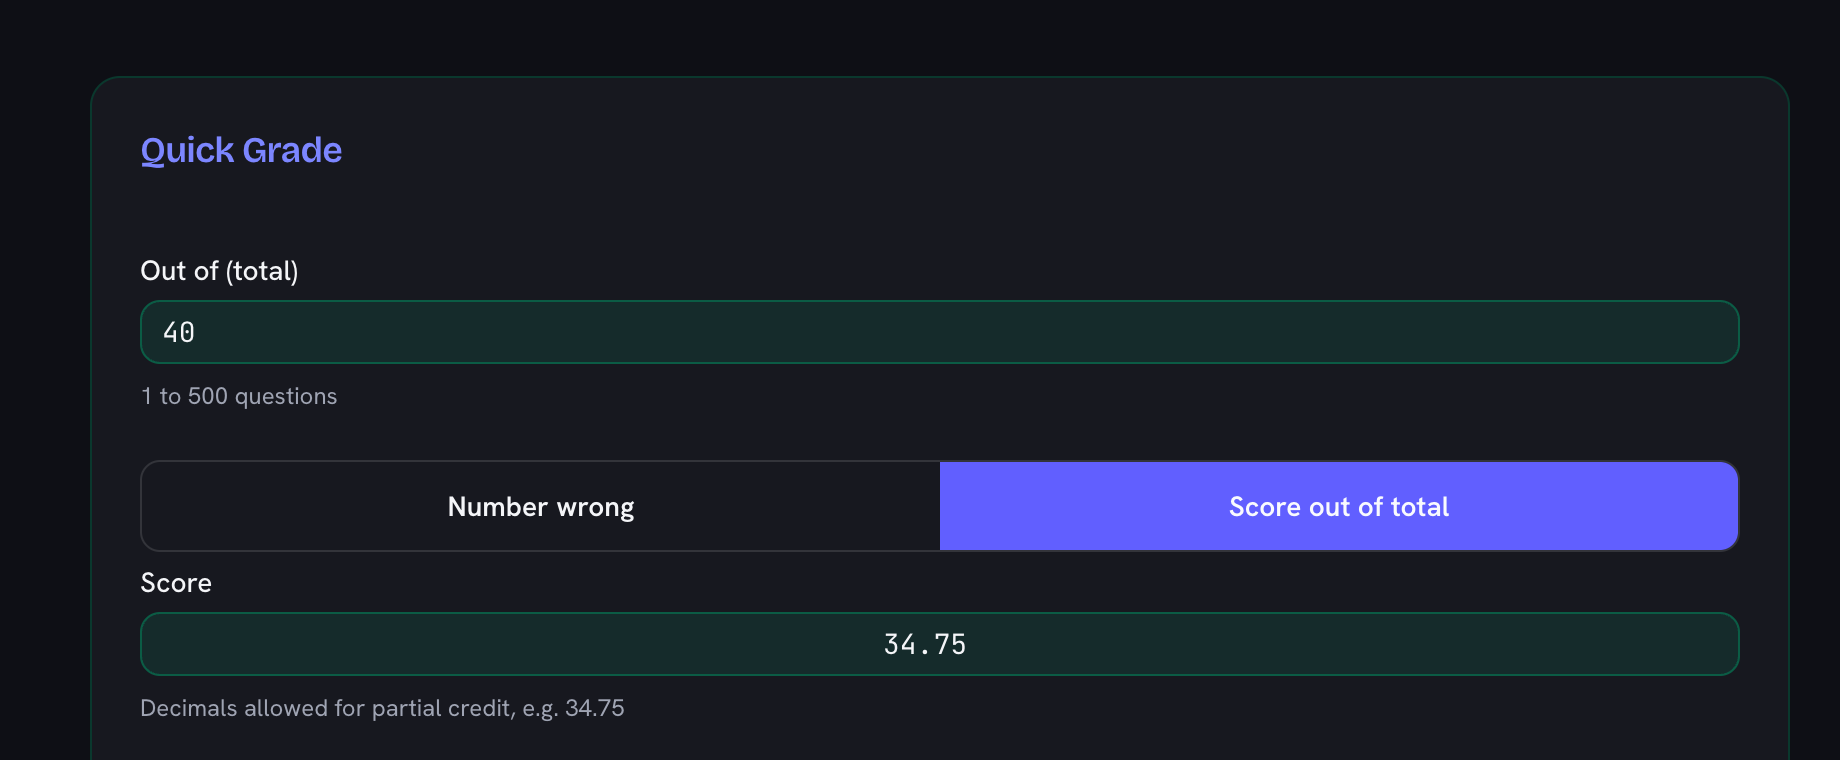
    Tap the + stepper once per mistake as you mark the paper. If you already have the score, switch the toggle to “Score out of total” and type it as it stands — 34.75 out of 40 goes in with its decimals intact, no subtraction first.

    The input switched to Score out of total with 34.75 typed in, decimals kept for partial credit
  3. Read the percentage and letter grade

    The result gives the percentage to one decimal place and the letter it earns on the standard US scale. In score mode it also shows how much was dropped: a whole number of wrong answers when the score is a whole number, and the points lost when partial credit put it between questions.

    The result panel reading 86.9% and a B, with 34.75 of 40 and 5.25 points dropped, about 5 wrong
  4. Curve the marks or print the chart

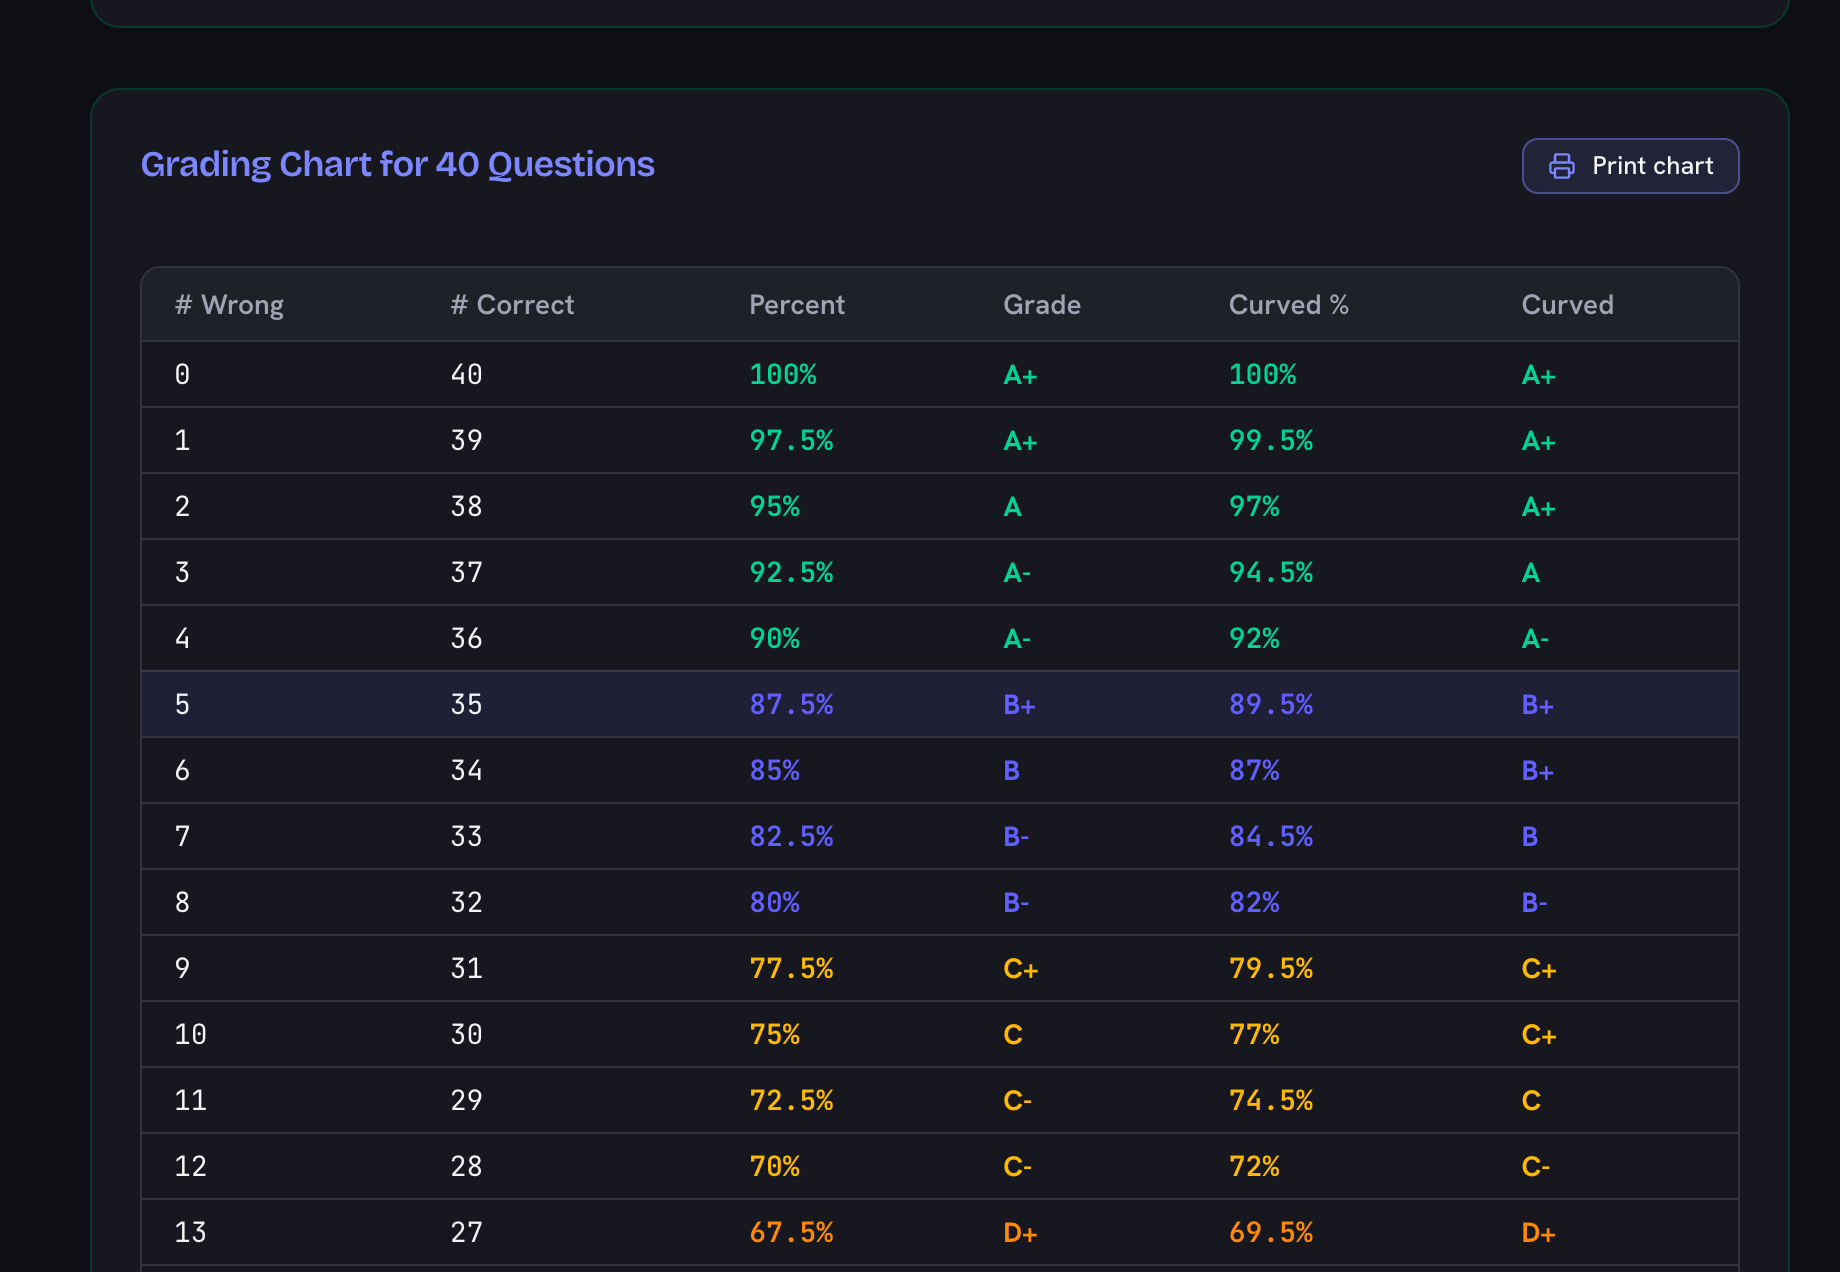
    Optional. Add flat points to every score or rescale so the best paper counts as 100%, and the chart lists raw and curved grades side by side. Print chart turns the whole thing into a one-page sheet to keep beside the stack.

    The grading chart for 40 questions listing raw and curved percentages side by side, with the Print chart button above it

Frequently Asked Questions

How do I calculate a test grade from the number wrong?

Enter how many questions the test has and how many were answered wrong — the calculator shows the percentage and letter grade instantly. The formula is (correct ÷ total) × 100; for example, 5 wrong out of 25 questions is 20 ÷ 25 = 80%, a B−.

What grade is 3 wrong out of 20?

Three wrong out of 20 questions is 17 correct, which is 85% — a solid B on the standard scale. Set the chart to 20 questions and every other combination is one glance away.

Is this the same as an EZ grader?

Yes — it works exactly like the classic slide-chart EZ graders teachers keep in their desk drawer, but digital: set the question count once and read the full wrong-answers-to-grade chart, or use the +/- steppers while working through a stack of papers. Print chart gives you a compact one-page version to keep next to the stack, for any question count.

How do I curve a test grade?

Two standard curves are built in. “+ points” adds a flat number of percentage points to every score (capped at 100) — the quick fix when a question turned out unfair. “Best score = 100%” rescales the whole class so the best paper counts as full marks: enter how many the best student got wrong, and every score is divided by that paper’s percentage. The chart shows raw and curved grades side by side so nothing is hidden.

How many questions can I get wrong and still pass?

Pick a target grade below the wrong-answer stepper and the calculator answers it for the test you are marking — on 50 questions with an 80% cutoff, 10. By hand, multiply the question count by the share you are allowed to lose: 50 × 0.20 = 10, or 22 on a 75-question test with a 70% cutoff. A curve, if you set one, is counted in.

What if I know the score, not the number wrong — like 19 out of 36?

Switch the calculator to score mode and type the two numbers as they stand: 19 and 36 give 52.8%, an F on the standard scale. Nothing needs subtracting first, and when the score is a whole number of questions the result names the wrong-answer equivalent too (17 wrong, here). The hand version is 19 ÷ 36.

What grade is 32 out of 35?

32 out of 35 is 91.4% — an A− on the standard scale. Other scores people ask about work the same way: 16 out of 17 is 94.1% (an A), 14 out of 17 is 82.4% (a B−), 22 out of 32 is 68.8% (a D+), and 7 out of 14 is exactly 50% (an F). Type both numbers into score mode, or divide correct by total yourself.

How do I grade a 20-question test?

On 20 questions each answer is worth 5 percentage points, so 1 wrong is 95% (A), 2 wrong 90% (A−), 3 wrong 85% (B), 4 wrong 80% (B−), and 5 wrong 75% (a C). Set the count to 20 in the calculator and the whole ladder is on screen. The condensed charts below cover the common sizes — 8, 10, 14, 15, 17, 18, 20, 25, 30, 32, 35, 40, and 50 questions — and the calculator prints the full scale for any other count.

How do I grade a decimal score, like 34.75 out of 40?

Type it in as it stands. Score mode takes decimals, and 34.75 out of 40 comes back as 86.9% — a B, a hair under the 87% B+ line. Partial credit almost never lands on a whole question, so the result reports the 5.25 points dropped rather than inventing a wrong-answer count, and the chart highlights the nearest whole-question row. Same for 52.8 out of 60 (88%, a B+) and 64.7 out of 70 (92.4%, an A−).

What letter grade scale does it use?

The standard US scale: A+ from 97%, A from 93%, A− from 90%, down in steps of roughly three to D− at 60%, with F below 60%. The scale is printed under the chart so you can adjust mentally if your school differs.

Can I use it for quizzes with any number of questions?

Yes — anywhere from 1 to 500 questions. Percentages are shown to one decimal place, which matters for short quizzes where each question is worth a lot.

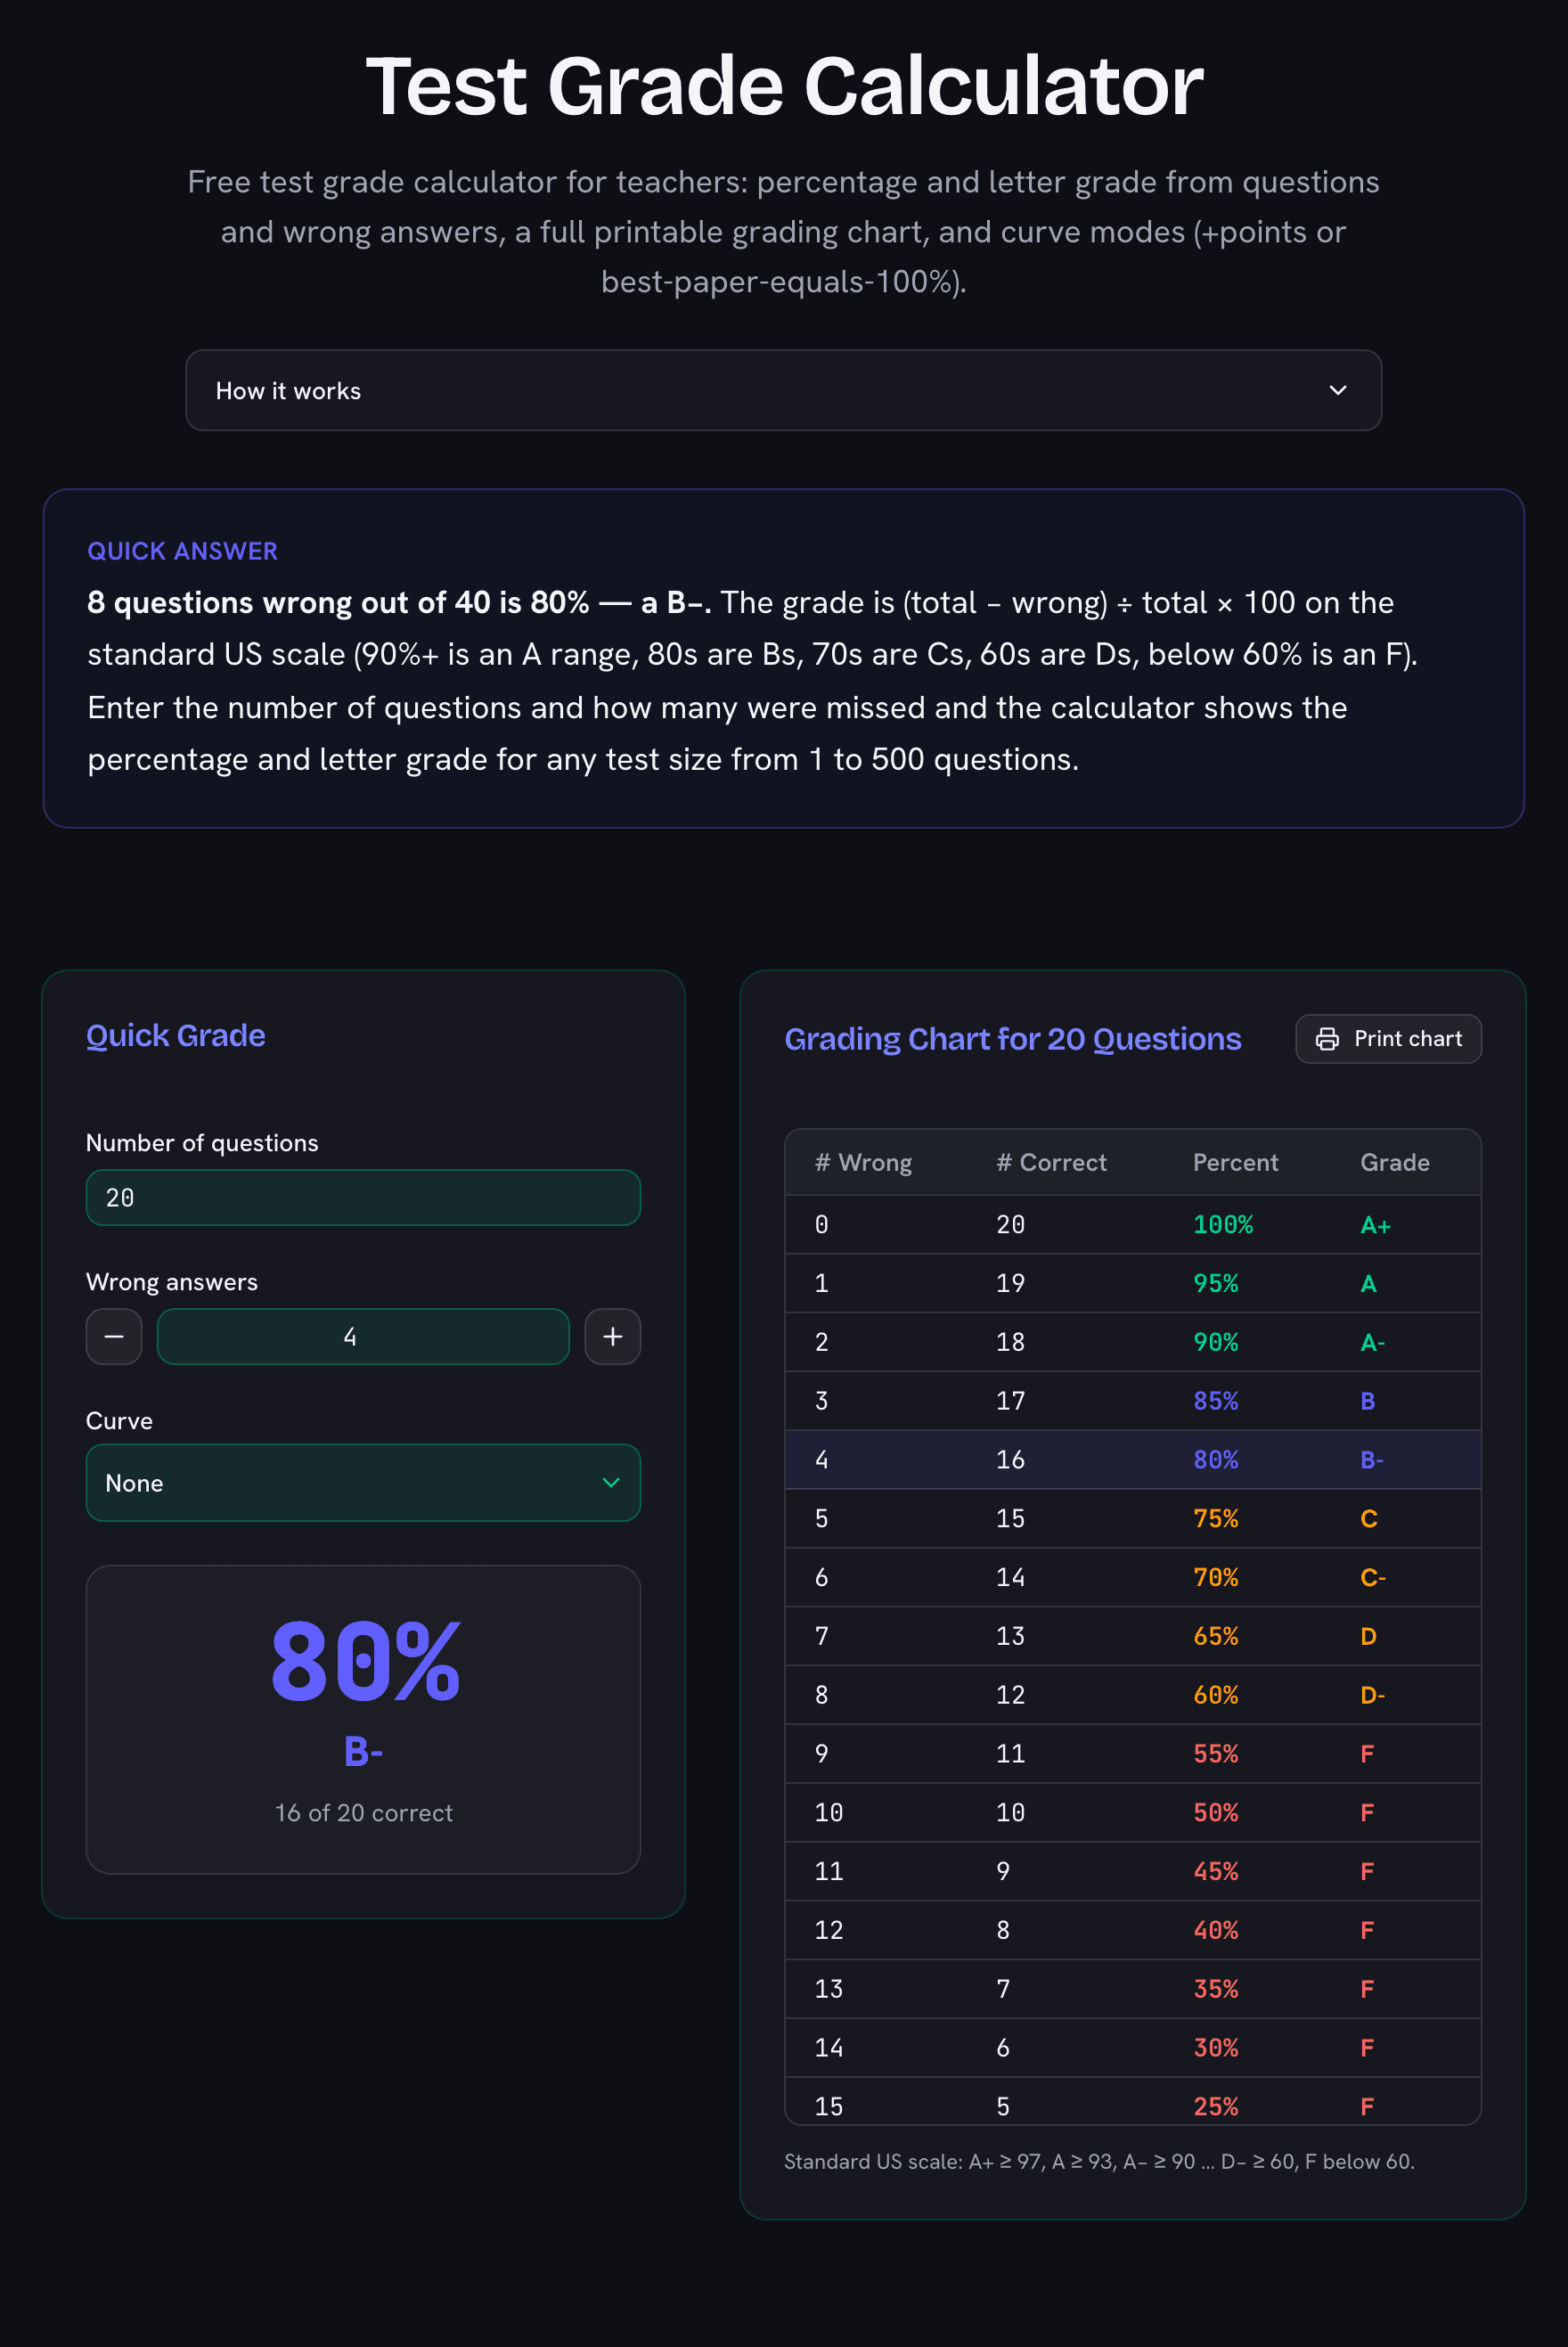
Test grade calculator showing 4 wrong out of 20 questions scoring 80% B-, next to the full grading chart
Set the question count once — the chart shows the grade for every possible number of wrong answers.